Complete the actions to take below. You can follow along with my video by clicking “Read Cash Course: Part 3”.
Action to Take
Log in to the Fast Fortune Network and post your best guess about the number one mistake people are making in the stock market every day.
We’ve been talking about that old-school, traditional investment “advice” Wall Street wants you to follow – like dumping your hard-earned money into mutual funds and waiting a good 15 to 30 years before you even get see any profits.
And today, we’re going to challenge another piece of so-called advice…
You can’t predict the stock market.
This “conventional wisdom” is something I’m willing to bet you’ve heard at some point in time from the financial pundits on TV, your spouse, a friend – heck, even your broker.
Now, it’s true that markets themselves are fickle beasts and are often driven more by emotion than by sheer logic and reason.
The same goes for stocks, which is why you’ll often hear traders and analysts talk about “sentiment,” or how the markets “feel” about a particular stock.
But while it’s true that there’s no (actual) crystal ball out there to tell you exactly what will happen in the stock market, you can predict where a stock or ETF is moving.
That’s right.
With the right tools, you can determine what a stock’s price will look like tomorrow, next week, next month, and beyond.
And it all boils down to these two little charts…
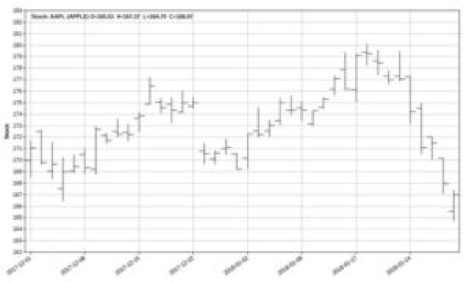
- Open, High, Low, Close (OHLC): this tracks a stock’s or ETF’s open, high, low, and closing price of each trading day. This is the most import type of chart that exists because it reveals the patterns that identify trends, such as reversals and inversions. In fact, every other chart out there comes from this one:
What you’re looking at above is an example of an OHLC chart that I pulled using my proprietary tools. The bars can represent different time increments (one minute, one month, one year, etc.); however, the standard time frame for this type of chart is one day. Regardless of the time increment the bar reflects, each bar will represent the open, high, low, and closing price of that time frame.
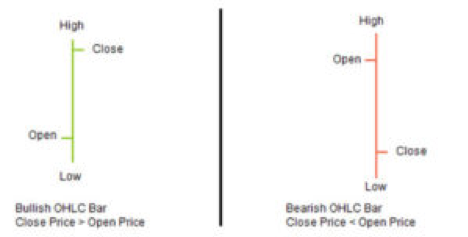
The high is marked by the extreme top part of the vertical bar. The low is marked by the extreme low of the vertical bar. A small horizontal line connected to the left part of the vertical bar represents the opening price. A small horizontal lined connected to the right part of the vertical bar represents the closing price:
Here’s an example of a bullish and bearish chart:
2. Candlestick: this chart not only tracks a stock’s or ETF’s opening, high, low, and closing prices – it also shows the range between the opening and closing prices as well as the highs and lows of the day. This is my favorite type of chart because it gives you an even better picture of trends that are forming or reversing in the markets.
Here’s an example of a candlestick chart that I pulled using my proprietary tools:

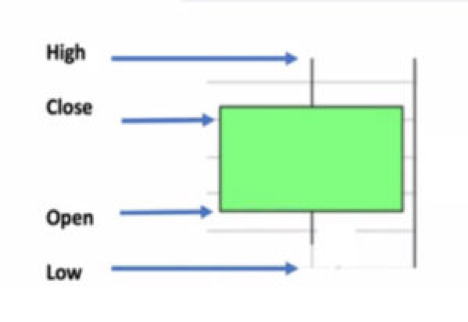
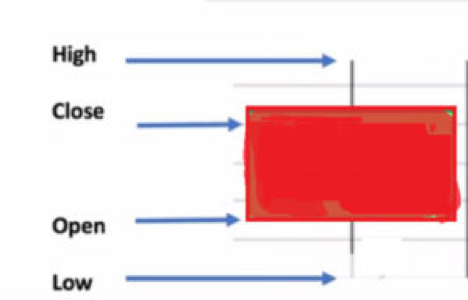
The distance between the opening and closing price is called the candle’s “real body.” The wick is the high above and the low below the opening and closing prices. If the opening price is higher than the closing price, then the real body of the candle is drawn in red or black. On the other hand, if the closing price higher, as we like to see in an uptrending (bullish) market, then the real body is usually clear or white. Keep in mind that these colors can vary from chart to chart.
You’ll also see that, in addition to the real body, that most candles have upper and lower shadows, which are drawn in as a single thin line from the top or bottom of the candle. These lines reflect a stock’s or ETF’s highs and lows. The upper shadows reveal the highest price achieved during the trading period while the lower shadows reveal the lowest price achieved during the trading period:
Bullish Candlestick
The last hour of the trading day is the most important one because it gives you clear clues as to where a stock (and the overall market) is heading next.
Now there’s a wide variety of patterns you can spot using candlestick charts, but these are the only two you need to know right now:
- Reversal Pattern: this signals that a price reversal is coming and gives you the chance to get in and out of your trades at the best price, with minimal risk, and maximum profit potential to the upside.
- Continuation Pattern: this signals a pause in a trending market. It’s a market movement that goes sideways or appears trendless. You can expect these “breaks in action” to resolve themselves in the same direction the market was heading before the pause.
The most important thing to remember is to trade what you see – not what you feel. You probably know or have heard of plenty of people who trade on emotion and the fear of missing out (FOMO) instead of facts and numbers. These are the ones who put their entire life savings into Enron back in 2001 before the scandal broke because it “felt right.”
But I know from my nearly 30 years in the industry that it’s not the only one…
In fact, there’s one mistake investors and traders alike make each and every day in the stock market –and it’s a big one.
And in Part 4, I’ll tell you exactly what it is…
Click the green button at the bottom of this page to continue to Part 4.
Q. Which two charts can help you predict where a stock or exchange-traded funds (ETF) will move next?
A. Top Movers & Bottom Movers
B. Open Interest & Volume
C. Open, High, Low, Close (OHLC) & Candlestick
Q. What’s the most important hour of the trading day?
A. The first hour (9:30 to 10:30 a.m. EST)
B. The “lunch” hour (12 noon EST to 1:00 p.m. EST)
C. The last hour (3:00 p.m. EST to 4:00 p.m. EST)
Q. This is the single most important thing to remember each and every time you trade
A. Trade what you see – not what you feel
B. Trade what you feel – not what you see
C. None of the above