Click here to download the PDF version: 
Stocks are constantly moving. In this market, that’s one undeniable fact. Stocks can go up, down, or sideways, but it doesn’t matter…
Eventually, stocks and stock volatility tend to return to the mean, or average.
It’s called “mean reversion.” Because stocks revert back to the mean.
Think of it like a stretched rubber band. You pull each side, stretching it out. Then, you release it – and it returns to average tension.

Stocks are just like a rubber band – and there’s a special indicator that can be used to predict when a “stretched” stock is ready to return to normal.
My name is Tom Gentile, and I’m going to show you exactly how to use that indicator today. I’ve used this technique – among others – to build up a massive fortune that’s earning me the title America’s #1 Pattern Trader.
And now, I want to help you do the same.
This indicator is called Bollinger Bands. Invented by John Bollinger, Bollinger Bands use statistics to determine the probability of a snapback in the market. By applying a statistical measure called “standard deviation” to a 21-day moving average, this indicator determines how much a stock’s price has been stretched.
Typically, Bollinger Bands use two standard deviations to plot upper and lower bands, as shown on the chart of the SPDR S&P 500 ETF (SPY) below:
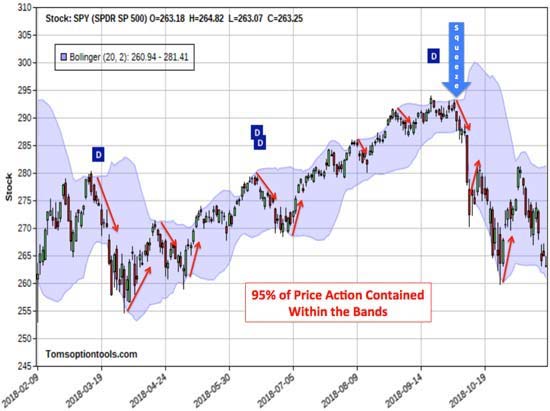
As you can see, the shaded area contains most of the price action – 95% of it, to be precise.
When a stock touches or crosses the outer limits of the band, it tends to snap back the other way. This makes sense when you consider that the stock will only be outside of the bands 5% of the time.
The SPY chart shows a number of signals that correctly called a nice directional trade. It also shows a few false signals or consecutive touches before actually snapping back.
For this reason, it’s important to confirm Bollinger Bands with other indicators like moving average convergence/divergence (MACD), relative strength index (RSI), stochastics, support/resistance, trend-lines, and volume.
John Bollinger himself suggests the use of confirming indicators!
The Quiet Before the Storm…
Stocks ready for a breakout often act like storms – things get quiet right before the action.
Bollinger Bands indicate this as well. They can reveal when a stock has gotten quiet, predicting when it’s poised for a breakout. Called “the squeeze,” this is revealed when the bands get closer together than normal.
In early October 2018, Bollinger Bands revealed a “squeeze” – and it was followed by an 11% correction in the market.
Stocks in a squeeze are great candidates for a trading strategy called a straddle. When you see a squeeze, consider placing an At-The-Money (ATM) straddle using 60-90 day options.
Playing Directional Breakouts
Stocks that are making the biggest moves and offering the best profits are also revealed by Bollinger Bands.
When a stock makes a strong move outside of the bands, it tends to keep on moving. Check out the strong moves identified on Phillips 66 (NYSE: PSX) below:
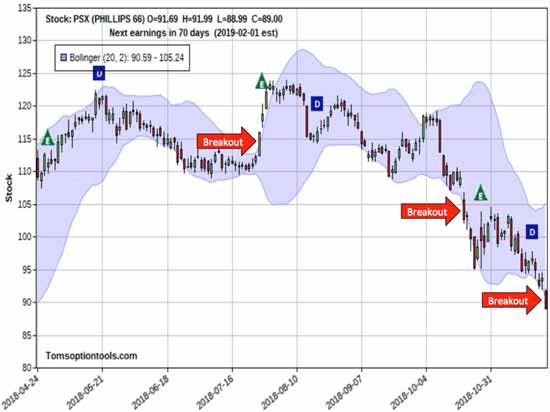
On three occasions, PSX broke outside of the band and kept on going, stretching the “rubber band” to its limits.
It’s important to confirm a strong breach of the bands by using other technical indicators, as mentioned above. My favorite is above average volume coupled with trend-lines and/or support/resistance.
As you can see, Bollinger Bands are very versatile and an excellent complement to your technical analysis arsenal – leading you to the biggest profits.
Sincerely,

Tom Gentile
America’s #1 Pattern Trader